Chart Gallery - Line Charts (1)


Pie Charts (1) Pie Charts (2) Bar Charts (1) Bar Charts (2) Line Charts (1) Line Charts (2) Area Charts Trending Charts Box Charts Scatter Charts 3D Scatter Charts Contour Charts Surface Charts Bubble Charts Vector Charts Gantt Charts Finance Charts Combo Charts Polar Charts (1) Polar Charts (2) Pyramids/Funnels Meters/Gauges (1) Meters/Gauges (2) Meters/Gauges (3) Meters/Gauges (4)
Track Cursors Clickable Charts Zooming/Scrolling Real-Time Charts

- A simple line chart with multiple lines.
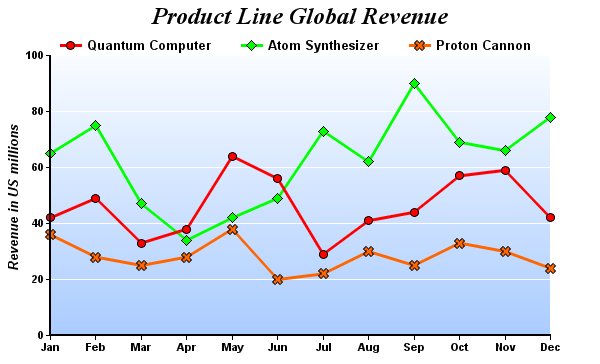
- A line chart using different symbols for the data points, with a gradient colored background.
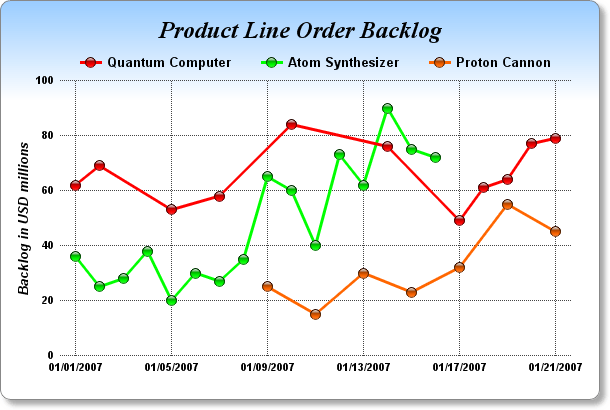
- A line chart using glass spheres for the data points, with a gradient colored background and a soft drop shadow.

- A line chart using glass spheres for the data points, with a brushed silver background.
- Note that there are missing data points in this chart. In ChartDirector, missing data points can be represented as gaps in the line. Alternatively, the line can join through the missing data points using a different line style.

- A line chart with a data table docked under the x-axis.

- A line chart using different symbols for different data points on the same line.

- A line chart with user-define custom symbols.

- A line chart with 2 layers - a line layer for the line, and a box-whisker layer for the error symbols.
- This chart demonstrates the power of ChartDirector's layering architecture. It allows one to combine arbitrary layers to create new chart styles using existing layer styles as building blocks.

- ChartDirector supports arbitrary number of axes per chart. This example demontrates using 4 independent y-axes.
